


Kursdetails
| Vortag Schluss | 42.319,74 (05.06.2025 | 00:00) |
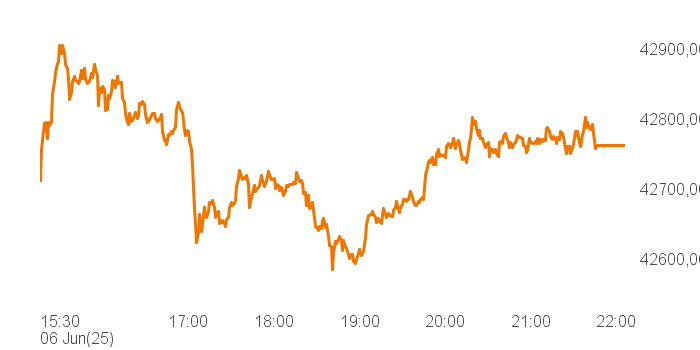
| Tagestief | 42.582,55 |
| Tageshoch | 42.924,56 |
| Eröffnung | 42.631,82 |
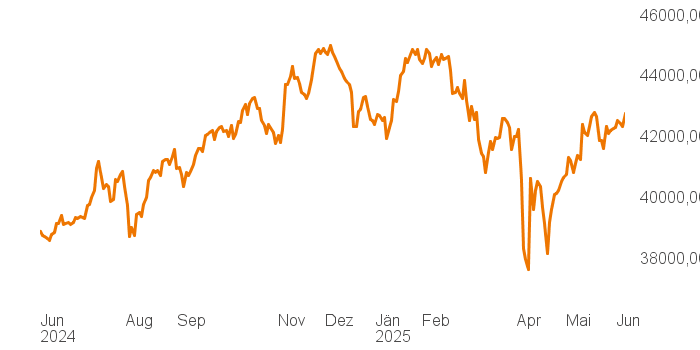
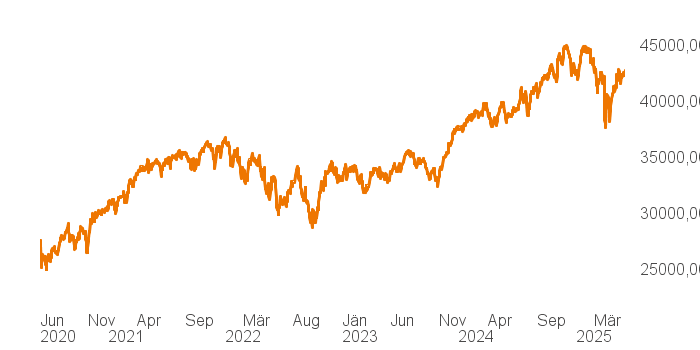
| 52-Wochenhoch | 45.014,04 (04.12.2024 | 00:00) |
| 52-Wochentief | 37.645,59 (08.04.2025 | 00:00) |

Indexwerte
Top & Flop
| Top | Aktuell | Diff% |
| Salesforce.com Inc | 274,51 | +2,76% |
| Amazon.com, Inc. | 213,57 | +2,72% |
| UnitedHealth Group Incorporated (DE) | 303,22 | +2,49% |
| Chevron Corporation | 140,21 | +2,42% |
| Cisco Systems, Inc. | 66,06 | +2,23% |
| Flop | Aktuell | Diff% |
| Home Depot, Inc. (The) | 367,33 | -0,53% |
| 3M Company | 145,50 | -0,52% |
| McDonald's Corporation | 307,36 | -0,52% |
| Wal-Mart Stores, Inc. | 97,47 | -0,50% |
| Sherwin Williams | 357,48 | -0,11% |
Performance
| Volumen | 416.673.467,00 |
| Jahreshoch | 44.882,13 (30.01.2025 | 00:00) |
| Jahrestief | 37.645,59 (08.04.2025 | 00:00) |
| Durchschn. Preis 1 Jahr | 41.898,01 |
| Durchschn. Preis 1 Monat | 42.153,02 |